
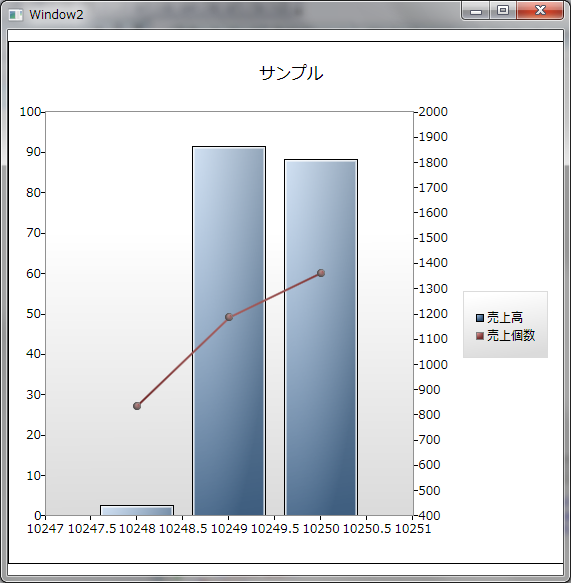
WPFで、チャートコントロールをコードから動的に作成する方法のサンプルです。
グラフの種類はフォームの時よりも少ないようです。
XAMLで設定する方法では、DataContextにDataTableのデータを設定して動きましたが、こちらではダメです。
ItemsSourceにIEnumerableのデータを設定します。
WPF ToolkitのDownloadサイト http://wpf.codeplex.com/Release/ProjectReleases.aspx?ReleaseId=29117
Window2.xaml
<window x:class="MSChartProject.Window2"
        xmlns="http://schemas.microsoft.com/winfx/2006/xaml/presentation"
        xmlns:x="http://schemas.microsoft.com/winfx/2006/xaml"
        title="Window2" height="523" width="566" loaded="Window_Loaded">
        <dockpanel name="DP" height="523" width="566">

        </dockpanel>
    </window>
C#
Window2.xaml.cs
using System;
using System.Collections.Generic;
using System.Linq;
using System.Data.Linq;
using System.Text;
using System.Windows;
using System.Windows.Controls;
using System.Windows.Data;
using System.Windows.Documents;
using System.Windows.Input;
using System.Windows.Media;
using System.Windows.Media.Imaging;
using System.Windows.Shapes;
using System.Windows.Controls.DataVisualization.Charting;
using System.Windows.Controls.DataVisualization;
using System.Data.SqlClient;
using System.Data;
namespace MSChartProject
{
    /// <summary>
    /// Window2.xaml の相互作用ロジック
    /// </summary>
    public partial class Window2 : Window
    {
        //ADO.NETを使用するときに使用
        public DataTable dt = new DataTable();
        SqlDataAdapter sda = new SqlDataAdapter();
        //ItemsSourceがIEnumberablを要求するために使用
        List<orderdetails> l = new List<orderdetails>();
        public Chart c1;
        public Window2()
        {
            InitializeComponent();

        }
        private void Window_Loaded(object sender, RoutedEventArgs e)
        {
            //接続情報のプレースホルダ
            SqlConnectionStringBuilder bldr = new SqlConnectionStringBuilder();
            //ローカルサーバを設定
            bldr.DataSource = ".";
            //データベースを設定
            bldr.InitialCatalog = "Northwind";
            //ログインしているアカウント情報を使用
            bldr.IntegratedSecurity = true;

            //LINQを使用する場合
            DataContext dc = new DataContext(bldr.ConnectionString);
            //テーブルのデータを保存する変数
            Table<orderdetails> od = dc.GetTable<orderdetails>();
            //メソッド形式を使用する場合の例
            var query = (from i in od
                         where i.OrderID <= 10250
                         select i).GroupBy(o => o.OrderID, (k, o) => new OrderDetails { OrderID = k, Quantity = o.Sum(p => p.Quantity), Proceeds = o.Sum(p => p.Quantity * p.Proceeds) });
            //糖衣構文を使用する場合の例
            //var query = from i in od
            //             where i.OrderID <= 10250
            //             group i by i.OrderID into grouping
            //             select new { OrderID = grouping.Key, Quantity = grouping.Sum(p => p.Quantity), Proceeds = grouping.Sum(p => p.UnitPrice * p.Quantity) };

            ////ADO.NETを使用する場合の例
            //using (SqlConnection conn = new SqlConnection(bldr.ConnectionString))
            //{
            //    using (SqlCommand cmd = new SqlCommand())
            //    {
            //        cmd.Connection = conn;
            //        cmd.CommandText = "SELECT OrderID,SUM(Quantity) AS Quantity,SUM(UnitPrice * Quantity) AS Proceeds FROM [Order Details] WHERE OrderID <= 10250 GROUP BY OrderID ORDER BY OrderID";
            //        this.sda.SelectCommand = cmd;
            //        this.sda.Fill(this.dt);
            //    }
            //}
            ////ItemsSourceがIEnumerableを要求するのでList型に移し替える処理
            //for (int i = 0; i < dt.Rows.Count; i++)
            //{
            //    l.Add(new OrderDetails((int)dt.Rows[i]["OrderID"], (int)dt.Rows[i][1], (decimal)dt.Rows[i][2]));
            //}
            //グラフの大本の変数
            c1 = new Chart();
            //折れ線グラフ
            LineSeries ls1 = new LineSeries();
            //棒グラフ
            ColumnSeries ls2 = new ColumnSeries();
            //面グラフ
            //AreaSeries ls1 = new AreaSeries();
            //横棒グラフ
            //BarSeries bs1 = new BarSeries();
            //バブルチャート
            //BubbleSeries ls1 = new BubbleSeries();
            //散布図
            //ScatterSeries ls1 = new ScatterSeries();
            //DataPointSeries
            //円グラフ
            //PieSeries ps1 = new PieSeries();
            //円グラフをチャートに追加
            //c1.Series.Add(ps1);
            //1番目のグラフのY軸
            LinearAxis y1 = new LinearAxis();
            y1.Maximum = 100.0;
            y1.Minimum = 0.0;
            //Y軸であることを指定
            y1.Orientation = AxisOrientation.Y;
            //2番目のグラフのY軸
            LinearAxis y2 = new LinearAxis();
            y2.Maximum = 2000;
            y2.Minimum = 400;
            //Y軸であることを指定
            y2.Orientation = AxisOrientation.Y;
            //X軸
            LinearAxis x1 = new LinearAxis();
            x1.Minimum = 10247;
            x1.Maximum = 10251;
            //X軸であることを指定
            x1.Orientation = AxisOrientation.X;
            //1番目のグラフのキーとなる値の軸を指定
            ls1.IndependentAxis = x1;
            //1番目のグラフの値となる値の軸を指定
            ls1.DependentRangeAxis = y1;
            //2番目のグラフのキーとなる値の軸を指定
            ls2.IndependentAxis = x1;
            //2番目のグラフの値となる値の軸を指定
            ls2.DependentRangeAxis = y2;
            //1番目のグラフのタイトル
            ls1.Title = "売上個数";
            //2番目のグラフのタイトル
            ls2.Title = "売上高";
            //1番目のグラフのキーとなる値の名前
            ls1.IndependentValuePath = "OrderID";
            //1番目のグラフの値となる値の名前
            ls1.DependentValuePath = "Quantity";
            //2番目のグラフのキーとなる値の名前
            ls2.IndependentValuePath = "OrderID";
            //2番目のグラフの値となる値の名前
            ls2.DependentValuePath = "Proceeds";
            //グラフの上部に表示されるタイトル名
            c1.Title = "サンプル";
            //チャートに各グラフを追加する
            c1.Series.Add(ls2);
            c1.Series.Add(ls1);
            //ps1.ItemsSource = query2;
            //それぞれにデータ変数を設定
            //LINQの場合
            ls1.ItemsSource = query;
            ls2.ItemsSource = query;
            //ADO.NETの場合
            //ls1.ItemsSource = l;
            //ls2.ItemsSource = l;
            //Windowにチャートコントロールを追加
            this.DP.Children.Add(c1);
        }
    }
}
データ用のクラス
using System;
using System.Collections.Generic;
using System.Linq;
using System.Text;
using System.Data.Linq;
using System.Data.Linq.Mapping;
using System.ComponentModel;
namespace MSChartProject
{
    [Table(Name="Order Details")]
    class OrderDetails : INotifyPropertyChanged
    {

        private int _o;
        private int _q;
        private decimal _u;
        [Column]
        public int OrderID
        {
            get { return _o; }
            set
            {
                _o = value;
                OnPropertyChanged("OrderID");
            }
        }
        [Column]
        public int Quantity
        {
            get { return _q; }
            set
            {
                _q = value;
                OnPropertyChanged("Quantity");
            }
        }
        [Column(Name="UnitPrice")]
        public decimal Proceeds
        {
            get { return _u; }
            set
            {
                _u = value;
                OnPropertyChanged("Proceeds");
            }
        }
        public event PropertyChangedEventHandler PropertyChanged;
        private void OnPropertyChanged(string name)
        {
            if (PropertyChanged != null)
            {
                PropertyChanged(this, new PropertyChangedEventArgs(name));
            }
        }
        public OrderDetails(int o, int q, decimal u)
        {
            OrderID = o;
            Quantity = q;
            Proceeds = u;
        }
        public OrderDetails()
        {
            OrderID = 0;
            Quantity = 0;
            Proceeds = 0;
        }
    }
}
VB.NET
Window2.xaml.vb
Imports System.Linq
Imports System.Data.Linq
Imports System.Data.Linq.Mapping
Imports System.ComponentModel
Imports System.Windows.Controls.DataVisualization.Charting
Imports System.Windows.Controls.DataVisualization
Imports System.Data.SqlClient
Imports System.Data
Class Window2
    'ADO.NETを使用するときに使用
    Dim dt As DataTable = New DataTable()
    Dim sda As SqlDataAdapter = New SqlDataAdapter()
    'ItemsSourceがIEnumberablを要求するために使用
    Dim l As List(Of OrderDetails) = New List(Of OrderDetails)()
    Private Sub Window2_Loaded(ByVal sender As System.Object, ByVal e As System.Windows.RoutedEventArgs) Handles MyBase.Loaded
        '接続情報のプレースホルダ
        Dim bldr As SqlConnectionStringBuilder = New SqlConnectionStringBuilder()
        'ローカルサーバを設定
        bldr.DataSource = "."
        'データベースを設定
        bldr.InitialCatalog = "Northwind"
        'ログインしているアカウント情報を使用
        bldr.IntegratedSecurity = True
        'LINQを使用する場合
        Dim dc As DataContext = New DataContext(bldr.ConnectionString)
        'テーブルのデータを保存する変数
        Dim od As Table(Of OrderDetails) = dc.GetTable(Of OrderDetails)()
        ''メソッド形式を使用する場合の例
        'Dim query = od.Where(Function(i) i.OrderID <= 10250).GroupBy(Function(o) o.OrderID, Function(k, o) New With {.OrderID = k, .Quantity = o.Sum(Function(p) p.Quantity), .Proceeds = o.Sum(Function(p) p.Quantity * p.Proceeds)})
        '糖衣構文を使用する場合の例
        Dim query = From i In od _
                        Where i.OrderID <= 10250 _
                        Group i By i.OrderID Into Group, Q = Sum(i.Quantity), P = Sum(i.Quantity * i.Proceeds) _
                        Select New OrderDetails(OrderID, Q, P)
        ''ADO.NETを使用する場合の例
        'Using conn As SqlConnection = New SqlConnection(bldr.ConnectionString)
        '    Using cmd As SqlCommand = New SqlCommand()
        '        cmd.Connection = conn
        '        cmd.CommandText = "SELECT OrderID,SUM(Quantity) AS Quantity,SUM(UnitPrice * Quantity) AS Proceeds FROM [Order Details] WHERE OrderID <= 10250 GROUP BY OrderID ORDER BY OrderID"
        '        Me.sda.SelectCommand = cmd
        '        Me.sda.Fill(Me.dt)
        '    End Using
        'End Using
        ''ItemsSourceがIEnumerableを要求するのでList型に移し替える処理
        'For i As Integer = 0 To dt.Rows.Count - 1 Step 1
        '    l.Add(New OrderDetails(CType(dt.Rows(i)("OrderID"), Integer), CType(dt.Rows(i)("Quantity"), Integer), CType(dt.Rows(i)("Proceeds"), Decimal)))
        'Next i
        'グラフの大本の変数
        Dim c1 As Chart = New Chart()
        '折れ線グラフ
        Dim ls1 As LineSeries = New LineSeries()
        '棒グラフ
        Dim ls2 As ColumnSeries = New ColumnSeries()
        '面グラフ
        'Dim ls1 As AreaSeries = New AreaSeries()
        '横棒グラフ
        'Dim bs1 As BarSeries = New BarSeries()
        'バブルチャート
        'Dim ls1 As BubbleSeries = New BubbleSeries()
        '散布図
        'Dim ls1 As ScatterSeries = New ScatterSeries()
        'DataPointSeries
        '円グラフ
        'Dim ps1 As PieSeries = New PieSeries()
        '円グラフをチャートに追加
        'c1.Series.Add(ps1)
        '1番目のグラフのY軸
        Dim y1 As LinearAxis = New LinearAxis()
        y1.Maximum = 100.0
        y1.Minimum = 0.0
        'Y軸であることを指定
        y1.Orientation = AxisOrientation.Y
        '2番目のグラフのY軸
        Dim y2 As LinearAxis = New LinearAxis()
        y2.Maximum = 2000
        y2.Minimum = 400
        'Y軸であることを指定
        y2.Orientation = AxisOrientation.Y
        'X軸
        Dim x1 As LinearAxis = New LinearAxis()
        x1.Minimum = 10247
        x1.Maximum = 10251
        'X軸であることを指定
        x1.Orientation = AxisOrientation.X
        '1番目のグラフのキーとなる値の軸を指定
        ls1.IndependentAxis = x1
        '1番目のグラフの値となる値の軸を指定
        ls1.DependentRangeAxis = y1
        '2番目のグラフのキーとなる値の軸を指定
        ls2.IndependentAxis = x1
        '2番目のグラフの値となる値の軸を指定
        ls2.DependentRangeAxis = y2
        '1番目のグラフのタイトル
        ls1.Title = "売上個数"
        '2番目のグラフのタイトル
        ls2.Title = "売上高"
        '1番目のグラフのキーとなる値の名前
        ls1.IndependentValuePath = "OrderID"
        '1番目のグラフの値となる値の名前
        ls1.DependentValuePath = "Quantity"
        '2番目のグラフのキーとなる値の名前
        ls2.IndependentValuePath = "OrderID"
        '2番目のグラフの値となる値の名前
        ls2.DependentValuePath = "Proceeds"
        'グラフの上部に表示されるタイトル名
        c1.Title = "サンプル"
        'チャートに各グラフを追加する
        c1.Series.Add(ls2)
        c1.Series.Add(ls1)
        'ps1.ItemsSource = query2
        'それぞれにデータ変数を設定
        'LINQの場合
        ls1.ItemsSource = query
        ls2.ItemsSource = query
        'ADO.NETの場合
        'ls1.ItemsSource = l
        'ls2.ItemsSource = l
        'Windowにチャートコントロールを追加
        Me.DP.Children.Add(c1)
    End Sub
End Class
データ用クラス
    <table(name: ="Order Details" )> _
 Public Class OrderDetails
    Implements INotifyPropertyChanged
    Private _o As Integer
    Private _q As Integer
    Private _u As Decimal
        <column()> _
    Public Property OrderID() As Integer
        Get
            Return _o
        End Get
        Set(ByVal value As Integer)
            _o = value
            OnPropertyChanged("OrderID")
        End Set
    End Property
        <column()> _
    Public Property Quantity() As Integer
        Get
            Return _q
        End Get
        Set(ByVal value As Integer)
            _q = value
            OnPropertyChanged("Quantity")
        End Set
    End Property
        <column(name: ="UnitPrice" )> _
    Public Property Proceeds() As Decimal
        Get
            Return _u
        End Get
        Set(ByVal value As Decimal)
            _u = value
            OnPropertyChanged("Proceeds")
        End Set
    End Property
    Public Event PropertyChanged(ByVal sender As Object, ByVal e As PropertyChangedEventArgs) Implements INotifyPropertyChanged.PropertyChanged
    Private Sub OnPropertyChanged(ByVal name As String)
        RaiseEvent PropertyChanged(Me, New PropertyChangedEventArgs(name))
    End Sub
    Public Sub New(ByVal o As Integer, ByVal q As Integer, ByVal u As Decimal)
        OrderID = o
        Quantity = q
        Proceeds = u
    End Sub
    Public Sub New()
        OrderID = 0
        Quantity = 0
        Proceeds = 0
    End Sub
End Class