
 >
>
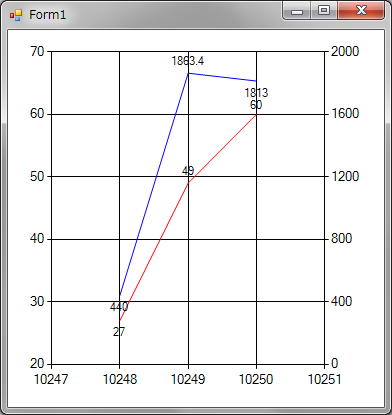
グラフの値を表示したい場合は、グラフごとに設定しないといけません。
シリーズのIsValueShownAsLabelプロパティをtrueに設定します。
それだけです。
using System;
using System.Collections.Generic;
using System.ComponentModel;
using System.Data;
using System.Drawing;
using System.Linq;
using System.Text;
using System.Windows.Forms;
using System.Data.SqlClient;
//チャートで必要な名前空間
using System.Windows.Forms.DataVisualization.Charting;
namespace Chart_Value
{
    public partial class Form1 : Form
    {
        SqlDataAdapter sda = new SqlDataAdapter();
        DataTable dt = new DataTable();
        Chart chart1 = new Chart();
        public Form1()
        {
            InitializeComponent();
        }
        private void Form1_Load(object sender, EventArgs e)
        {
            //ADO.NETでデータを取得する。
            SqlConnectionStringBuilder bldr = new SqlConnectionStringBuilder();
            bldr.DataSource = ".";
            bldr.InitialCatalog = "Northwind";
            bldr.IntegratedSecurity = true;
            using (SqlConnection conn = new SqlConnection(bldr.ConnectionString))
            {
                using (SqlCommand cmd = new SqlCommand())
                {
                    cmd.Connection = conn;
                    cmd.CommandText = "SELECT OrderID,SUM(Quantity) AS Quantity,SUM(UnitPrice * Quantity) AS Proceeds FROM [Order Details] WHERE OrderID <= 10250 GROUP BY OrderID ORDER BY OrderID";
                    this.sda.SelectCommand = cmd;
                    this.sda.Fill(this.dt);
                }
            }
            //チャートエリアの追加の仕方
            ChartArea a1 = new ChartArea("main");
            this.chart1.ChartAreas.Add(a1);
            //左側のY軸の設定
            Axis y1 = new Axis();
            //目盛の間隔を10に設定
            y1.Interval = 10.0d;
            //目盛の最小値を20に設定
            y1.Minimum = 20.0d;
            //目盛の最大値を70に設定
            y1.Maximum = 70.0d;
            //左のY軸になるように設定
            a1.AxisY = y1;
            //右側のY軸の設定
            Axis y2 = new Axis();
            //目盛の間隔を400に設定
            y2.Interval = 400.0d;
            //右のY軸になるように設定
            a1.AxisY2 = y2;
            //一つ目のグラフのインスタンス
            Series s1 = new Series();
            //凡例での名前を設定
            s1.LegendText = "売上数量";
            //グラフの種類を折れ線グラフに設定
            s1.ChartType = SeriesChartType.Line;
            //グラフの色を指定
            s1.Color = Color.Red;
            //X軸のデータ名を設定
            s1.XValueMember = "OrderID";
            //下側のX軸の目盛を使用する
            s1.XAxisType = AxisType.Primary;
            //Y軸のデータ名を設定
            s1.YValueMembers = "Quantity";
            //左側のY軸の目盛を使用する
            s1.YAxisType = AxisType.Primary;
            //使用するチャートエリアを指定する
            s1.ChartArea = "main";
            //グラフでの値を表示する
            s1.IsValueShownAsLabel = true;
            //二つ目のグラフのインスタンス
            Series s2 = new Series();
            //凡例での名前を設定
            s2.LegendText = "売上";
            //グラフの種類を折れ線グラフに設定
            s2.ChartType = SeriesChartType.Line;
            //グラフの色を指定
            s2.Color = Color.Blue;
            //X軸のデータ名を設定
            s2.XValueMember = "OrderID";
            //下側のX軸の目盛を使用する
            s2.XAxisType = AxisType.Primary;
            //Y軸のデータ名を設定
            s2.YValueMembers = "Proceeds";
            //右側のY軸の目盛を使用する
            s2.YAxisType = AxisType.Secondary;
            //使用するチャートエリアを指定する
            s2.ChartArea = "main";
            //グラフでの値を表示する
            s2.IsValueShownAsLabel = true;
            //グラフを追加するときに、後の方が上になる。
            this.chart1.Series.Add(s2);
            this.chart1.Series.Add(s1);
            //データをセットする。
            this.chart1.DataSource = dt;
            //フォームにチャートコントロールを追加
            this.Controls.Add(this.chart1);
            //全面表示に設定
            this.chart1.Dock = DockStyle.Fill;
        }
    }
}