
 >
>
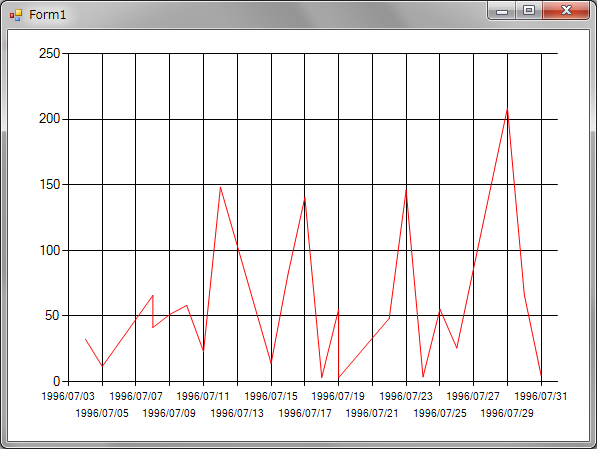
サンプルではX軸が日時のタイプです。
目盛の間隔を2日にしています。
肝は軸のプロパティのIntervalOffsetTypeの設定の仕方です。
これを変えることによって目盛の間隔が分単位だったり日単位だったりします。
using System;
using System.Collections.Generic;
using System.ComponentModel;
using System.Data;
using System.Drawing;
using System.Linq;
using System.Text;
using System.Windows.Forms;
using System.Data.SqlClient;
//チャートで必要な名前空間
using System.Windows.Forms.DataVisualization.Charting;
namespace Chart_DateAxis
{
    public partial class Form1 : Form
    {
        SqlDataAdapter sda = new SqlDataAdapter();
        DataTable dt = new DataTable();
        Chart chart1 = new Chart();
        public Form1()
        {
            InitializeComponent();
        }
        private void Form1_Load(object sender, EventArgs e)
        {
            //ADO.NETでデータを取得する。
            SqlConnectionStringBuilder bldr = new SqlConnectionStringBuilder();
            bldr.DataSource = ".";
            bldr.InitialCatalog = "Northwind";
            bldr.IntegratedSecurity = true;
            using (SqlConnection conn = new SqlConnection(bldr.ConnectionString))
            {
                using (SqlCommand cmd = new SqlCommand())
                {
                    cmd.Connection = conn;
                    cmd.CommandText = "SELECT OrderDate, Freight FROM [Orders] WHERE OrderDate BETWEEN '1996/07/01' AND '1996/07/31' ORDER BY OrderDate";
                    this.sda.SelectCommand = cmd;
                    this.sda.Fill(this.dt);
                }
            }
            //チャートエリアの追加の仕方
            ChartArea a1 = new ChartArea("main");
            this.chart1.ChartAreas.Add(a1);
            //X軸の設定
            Axis x1 = new Axis();
            x1.Interval = 2.0d;
            //目盛を日にちで判断するように設定
            //時間や分で判断するようにもできる。
            x1.IntervalOffsetType = DateTimeIntervalType.Days;
            //X軸として設定
            a1.AxisX = x1;
            //一つ目のグラフのインスタンス
            Series s1 = new Series();
            //凡例での名前を設定
            s1.LegendText = "Feight";
            //グラフの種類を折れ線グラフに設定
            s1.ChartType = SeriesChartType.Line;
            //グラフの色を指定
            s1.Color = Color.Red;
            //X軸のデータ名を設定
            s1.XValueMember = "OrderDate";
            //下側のX軸の目盛を使用する
            s1.XAxisType = AxisType.Primary;
            //Y軸のデータ名を設定
            s1.YValueMembers = "Freight";
            //左側のY軸の目盛を使用する
            s1.YAxisType = AxisType.Primary;
            //使用するチャートエリアを指定する
            s1.ChartArea = "main";
            //グラフを追加する。
            this.chart1.Series.Add(s1);
            //データをセットする。
            this.chart1.DataSource = dt;
            this.Controls.Add(this.chart1);
            this.chart1.Dock = DockStyle.Fill;
        }
    }
}