
 >
>
 >
>
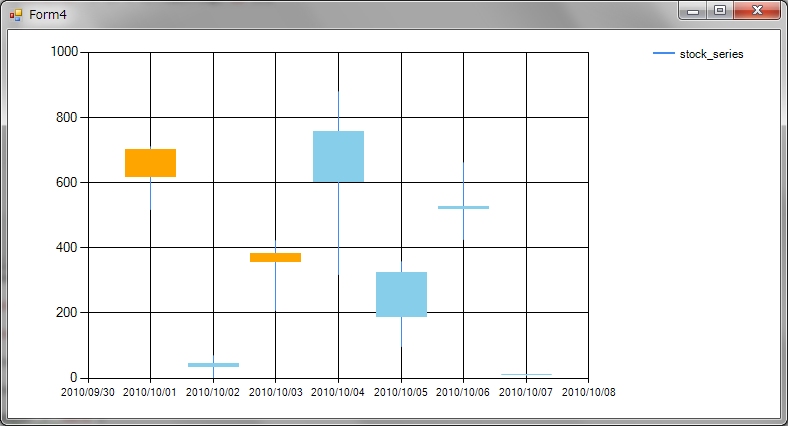
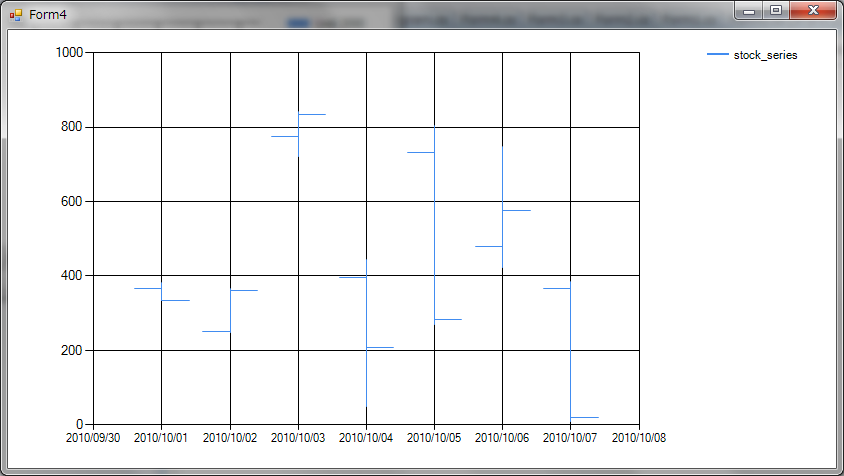
MSチャートを使っての株価チャートを作成する例です。
チャートタイプには、CandlestickとStockが使えます。注意が必要なのは、YValueMembersで、複数のデータを指定するときはカンマで区切って指定します。
株価チャートの場合は、高値、安値、始値、終値の順に指定します。
        Chart _chart1 = new Chart();
        DataSet _ds = new DataSet();
        public Form4()
        {
            InitializeComponent();
        }
        private void Form4_Load(object sender, EventArgs e)
        {
            DataTable dt = new DataTable("stock");
            dt.Columns.Add(new DataColumn("date",typeof(DateTime)));
            dt.Columns.Add(new DataColumn("open",typeof(int)));
            dt.Columns.Add(new DataColumn("close", typeof(int)));
            dt.Columns.Add(new DataColumn("high", typeof(int)));
            dt.Columns.Add(new DataColumn("low", typeof(int)));
            Random rnd = new Random(DateTime.Now.Second);
            for (int i = 0; i < 7; i++)
            {
                DataRow dr = dt.NewRow();
                //日付
                dr["date"] = DateTime.Parse("2010/10/" + (i + 1).ToString("00"));
                //高値
                dr["high"] = rnd.Next(1000);
                //安値
                dr["low"] = rnd.Next((int)dr["high"]);
                //始値
                dr["open"] = rnd.Next((int)dr["low"], (int)dr["high"]);
                //終値
                dr["close"] = rnd.Next((int)dr["low"], (int)dr["high"]);
                dt.Rows.Add(dr);
            }
            this._ds.Tables.Add(dt);
            //表示エリアを設定
            this._chart1.ChartAreas.Add(new ChartArea("chart1"));
            //グラフを設定
            this._chart1.Series.Add(new Series("stock_series"));
            //凡例
            this._chart1.Legends.Add(new Legend("legend1"));
            //株価チャートタイプに設定
            this._chart1.Series[0].ChartType = SeriesChartType.Candlestick; //Stockでもよい
            //横軸を日付タイプに設定
            this._chart1.Series[0].XValueType = ChartValueType.Date;
            //縦軸を整数に設定
            this._chart1.Series[0].YValueType = ChartValueType.Int32;
            //横軸をdateに設定
            this._chart1.Series[0].XValueMember = "date";
            //縦軸は、high,low,open,closeの順に設定
            this._chart1.Series[0].YValueMembers = "high,low,open,close";
            //株価上昇時の色(指定したい場合)
            this._chart1.Series[0]["PriceUpColor"] = "Orange";
            //株価下降時の色(指定したい場合)
            this._chart1.Series[0]["PriceDownColor"] = "SkyBlue";
            //データソースを設定
            this._chart1.DataSource = this._ds;
            this._chart1.DataBind();
            //フォームにチャートコントロールを追加
            this.Controls.Add(this._chart1);
            this._chart1.ChartAreas[0].Visible = true;
            this._chart1.Dock = DockStyle.Fill;
        }