
MSチャートでは円グラフも表示できます。その時に一部を切り離したりしたいかと思いますが、可能です。
一つ目のソースコードでは、データの1番目のデータのみを切り離しています。
もちろん、複数のデータを切り離すことも可能です。その時は複数のポイントに対して、Explodedプロパティにtrueを設定すればよいです。
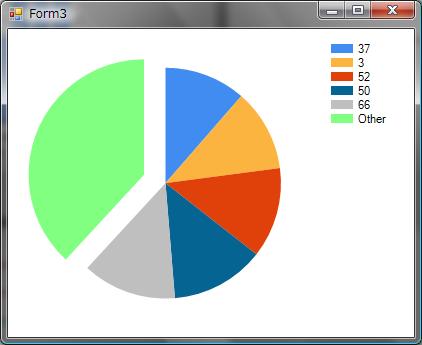
また、一定の値以下、または一定の割合以下のデータを「その他」として扱いたい時もあると思います。それも可能ですし、またそのデータを切り離すことも可能です
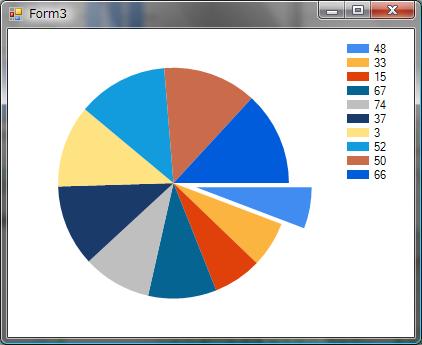
個々のデータを切り離したい場合
using System;
using System.Collections.Generic;
using System.ComponentModel;
using System.Data;
using System.Drawing;
using System.Linq;
using System.Text;
using System.Windows.Forms;
using System.Windows.Forms.DataVisualization.Charting;
using System.Data.SqlClient;
namespace ChartTest
{
    public partial class Form3 : Form
    {
        public Form3()
        {
            InitializeComponent();
        }
        Chart _chart = new Chart();
        DataSet _ds = new DataSet();
        private void Form3_Load(object sender, EventArgs e)
        {
            this._ds.Clear();
            SqlConnectionStringBuilder bldr = new SqlConnectionStringBuilder();
            bldr.IntegratedSecurity = true;
            bldr.DataSource = @".\SQLEXPRESS";
            bldr.InitialCatalog = "Northwind";
            using (SqlConnection conn = new SqlConnection(bldr.ConnectionString))
            {
                using (SqlCommand cmd = new SqlCommand())
                {
                    cmd.Connection = conn;
                    cmd.CommandText = "select top 10 productid, sum(unitprice * quantity) as total_sales from [Order Details]  group by productid  order by total_sales";
                    SqlDataAdapter sda = new SqlDataAdapter();
                    sda.SelectCommand = cmd;
                    sda.Fill(this._ds);
                }
            }
            //チャートエリアを追加
            this._chart.ChartAreas.Add(new ChartArea("area1"));
            //凡例を追加
            this._chart.Legends.Add(new Legend("legend1"));
            //グラフの元を追加
            this._chart.Series.Add(new Series("pie_series"));
            //グラフを表示するチャートエリアを設定
            this._chart.Series[0].ChartArea = "area1";
            //グラフのX軸のデータメンバーを設定
            this._chart.Series[0].XValueMember = "productid";
            //グラフのY軸のデータメンバーを設定
            this._chart.Series[0].YValueMembers = "total_sales";
            //グラフのタイプに円グラフを設定
            this._chart.Series[0].ChartType = SeriesChartType.Pie;
            //グラフの凡例を設定
            this._chart.Series[0].Legend = "legend1";
            //データソースを設定
            this._chart.DataSource = this._ds;
            //データソースを強制的にバインド
            this._chart.DataBind();
            //データソースの1番目のデータを切り離して表示するに設定。
            //この前にデータソースがバンドされていないとエラーになる。
            this._chart.Series[0].Points[0]["Exploded"] = "true";
            this.Controls.Add(this._chart);
            this._chart.Dock = DockStyle.Fill;
        }
    }
}
その他の扱いをしたいデータがある場合
using System;
using System.Collections.Generic;
using System.ComponentModel;
using System.Data;
using System.Drawing;
using System.Linq;
using System.Text;
using System.Windows.Forms;
using System.Windows.Forms.DataVisualization.Charting;
using System.Data.SqlClient;
namespace ChartTest
{
    public partial class Form3 : Form
    {
        public Form3()
        {
            InitializeComponent();
        }
        Chart _chart = new Chart();
        DataSet _ds = new DataSet();
        private void Form3_Load(object sender, EventArgs e)
        {
            this._ds.Clear();
            SqlConnectionStringBuilder bldr = new SqlConnectionStringBuilder();
            bldr.IntegratedSecurity = true;
            bldr.DataSource = @".\SQLEXPRESS";
            bldr.InitialCatalog = "Northwind";
            using (SqlConnection conn = new SqlConnection(bldr.ConnectionString))
            {
                using (SqlCommand cmd = new SqlCommand())
                {
                    cmd.Connection = conn;
                    cmd.CommandText = "select top 10 productid, sum(unitprice * quantity) as total_sales from [Order Details]  group by productid  order by total_sales";
                    SqlDataAdapter sda = new SqlDataAdapter();
                    sda.SelectCommand = cmd;
                    sda.Fill(this._ds);
                }
            }
            //チャートエリアを追加
            this._chart.ChartAreas.Add(new ChartArea("area1"));
            //凡例を追加
            this._chart.Legends.Add(new Legend("legend1"));
            //グラフの元を追加
            this._chart.Series.Add(new Series("pie_series"));
            //グラフを表示するチャートエリアを設定
            this._chart.Series[0].ChartArea = "area1";
            //グラフのX軸のデータメンバーを設定
            this._chart.Series[0].XValueMember = "productid";
            //グラフのY軸のデータメンバーを設定
            this._chart.Series[0].YValueMembers = "total_sales";
            //グラフのタイプに円グラフを設定
            this._chart.Series[0].ChartType = SeriesChartType.Pie;
            //グラフの凡例を設定
            this._chart.Series[0].Legend = "legend1";
            //ここでカスタムプロパティーを設定しています。
            //設定している内容は、円グラフのスタートする角度を270度、その他のデータの色を(128,255,128)に、
            //その他に含めるデータの全体に対するここの割合の設定、その他のデータを切り離す
            //に設定しています。
            this._chart.Series[0].CustomProperties = @"PieStartAngle=270, CollectedColor=128\, 255\, 128, CollectedThreshold=10, CollectedSliceExploded=True";
            //その他に含める値を割合ではなく、ある値以下にしたい場合は次のようになります。
            //CollectedThresholdUsePercent=Falseが増えていることに注意です。
            //"PieStartAngle=270, CollectedColor=128\, 255\, 128, CollectedThresholdUsePercent=False, CollectedThreshold=2000, CollectedSliceExploded=True"
            //データソースを設定
            this._chart.DataSource = this._ds;
            this.Controls.Add(this._chart);
            this._chart.Dock = DockStyle.Fill;
        }
    }
}